周报:2020-11-30~2020-12-6


Paper 1

Title

《基于非负矩阵分解数值方法的集成光子腔光谱技术》

[1] Huang Z , Xiong D , Zhang G , et al. Nonnegative Matrix Factorization Numerical Method for Integrated Photonic Cavity Based Spectroscopy[J]. Journal of Nanomaterials, 2014, 2014:1-5.

Contents

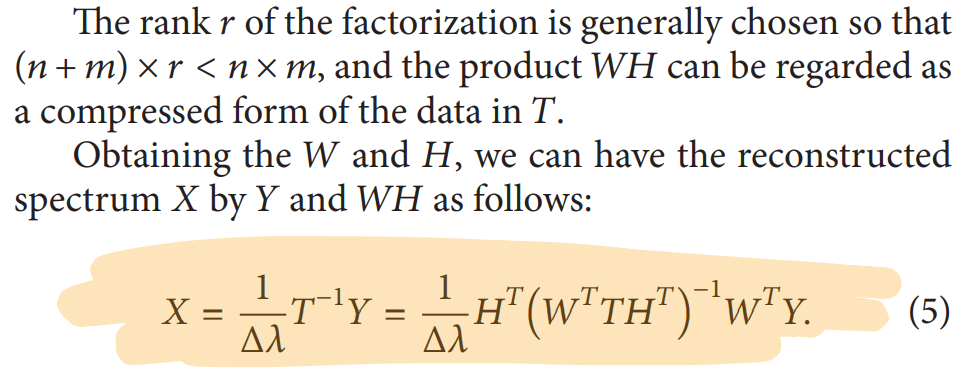
数学模型与传统的光谱重建方法相同,最终都归结为一个解欠定线性方程组的问题,本文对于传递矩阵$T$的处理方式有所不同,它使用了线性代数方法 非负矩阵分解

这样一来,一个大规模的欠定问题(Undetermined)就被降维了,因为一个$n\times m$的矩阵被标示位了一个$n\times r$和一个$r\times m$的矩阵的乘积,类似于接下来要看的压缩感知

所选取的128个通道的滤波器如下图所示:
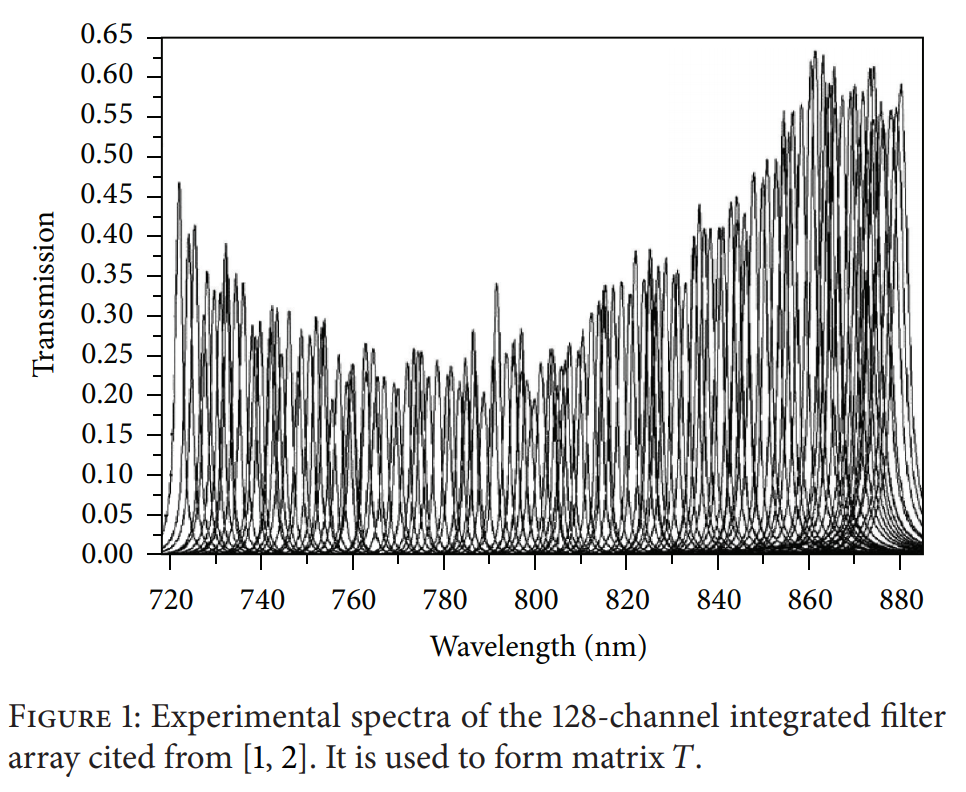
image-20201210143043332

最终的解析解如下:

image-20201210143119209

Results

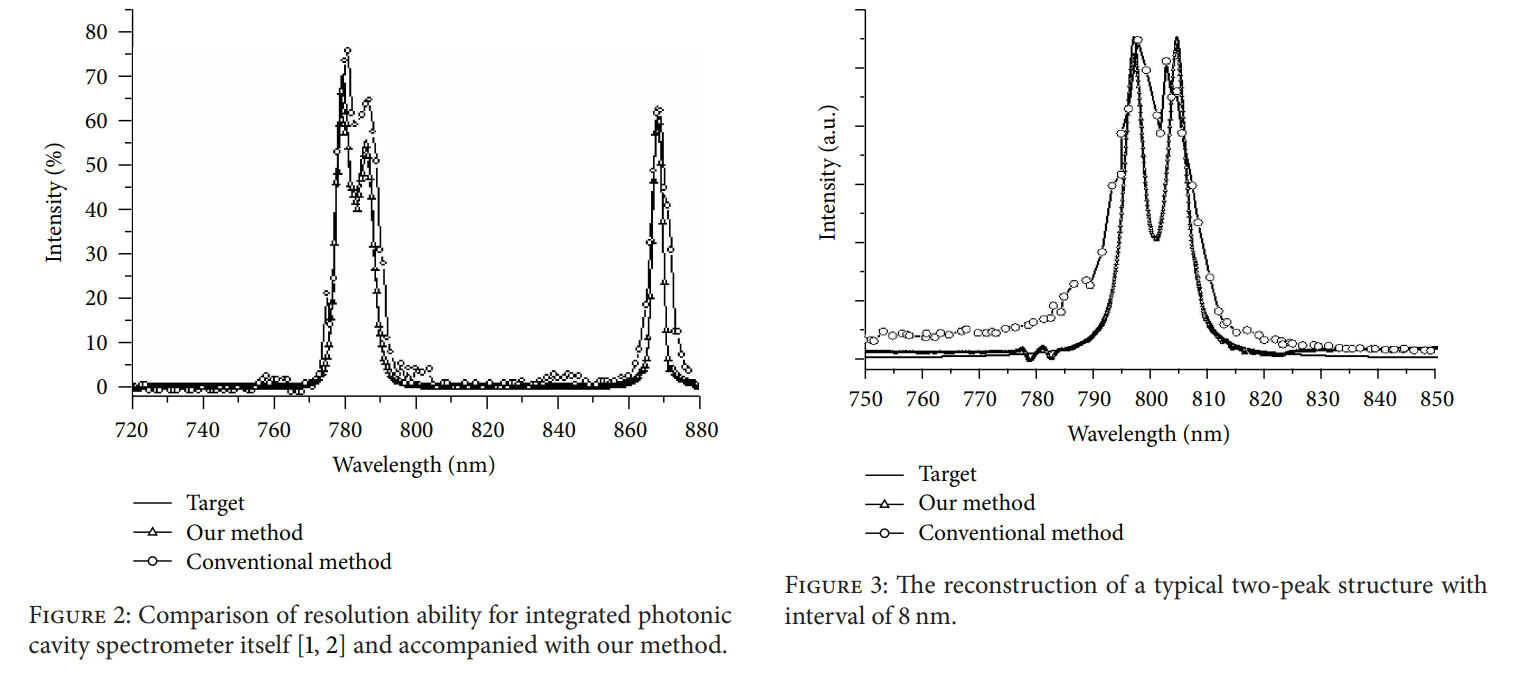
重建结果要明显优于传统方法

image-20201210143225603

Paper 2

这是一篇压缩感知经典文献,但是由于时间关系并没有看完,打算下周看完,并放在下周记录

OMP algorithm

这周还完成了一个比较经典的压缩感知重建算法OMP算法(正交匹配追踪), 它是传统的MP算法的改进

参考资料:

  • [1] Pati Y C , Rezaiifar R , Krishnaprasad P S . Orthogonal Matching Pursuit: Recursive Function Approximation with Applications to Wavelet Decomposition[C]// 1993:40-44.

  • 正交匹配跟踪算法OMP - 阿珺的文章 - 知乎 https://zhuanlan.zhihu.com/p/52276805

  • 形象易懂讲解算法II——压缩感知 - 咚懂咚懂咚的文章 - 知乎 https://zhuanlan.zhihu.com/p/22445302

Contents

对于一个压缩感知问题,我们可以写成如下的一个矩阵表示的线性方程组形式

目前,已知向量$y$和压缩感知矩阵$A$,需要求向量$x$,令$y$的长度位$n$,$x$的长度为$m$,则满足$n<<m$,是一个典型的欠定问题

我们认为$A$的每一列元素都是一个基信号,称为原子,可以将A表示为

于是,我们可以将$y$写成每一个$A$原子的线性组合:

OMP算法流程:

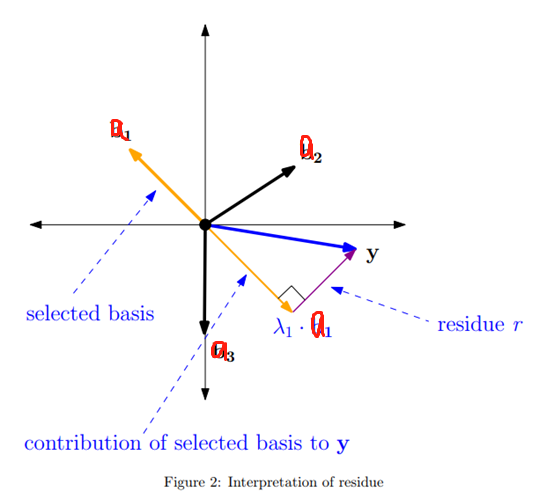
  1. 定义一个残差值 $r$(初值为$y$),一个空的原子序列$A_{new}$,和一个空的稀疏系数值$x_{rec}$

  2. 计算A中每个原子对于残差$r$的贡献,即 计算 $\langle a_i,r\rangle$,并找到对y影响最大的原子,即 绝对值最大的原子:

  1. 将这个最大的贡献值定义为A与y的相关系数,并将这个原子加入原子序列
  2. 计算该原子序列对于y的贡献,得到的值用于更新$x_{rec}$
  3. 从y中减去这个原子序列贡献的影响,得到新的残差,即 从y中减去所有与该原子序列有关的信息,使得新残差r与该原子序列正交,如下图所示:
img

  1. 回到第2步,反复迭代,直到达到迭代次数 $I$(即 稀疏系数$K$)

最终得到的$x_{rec}$即为我们需要的稀疏系数向量

需要注意的是:OMP算法要保证压缩感知矩阵A的每个列(原子)都两两不相关,否则容易出现错误的解

Experiment

这次用到的是一个$256\times256$的lena.jpg,重建单通道(Blue)像素值

采用DCT(离散余弦变换)作为系数基矩阵,随机的高斯分布为观测矩阵

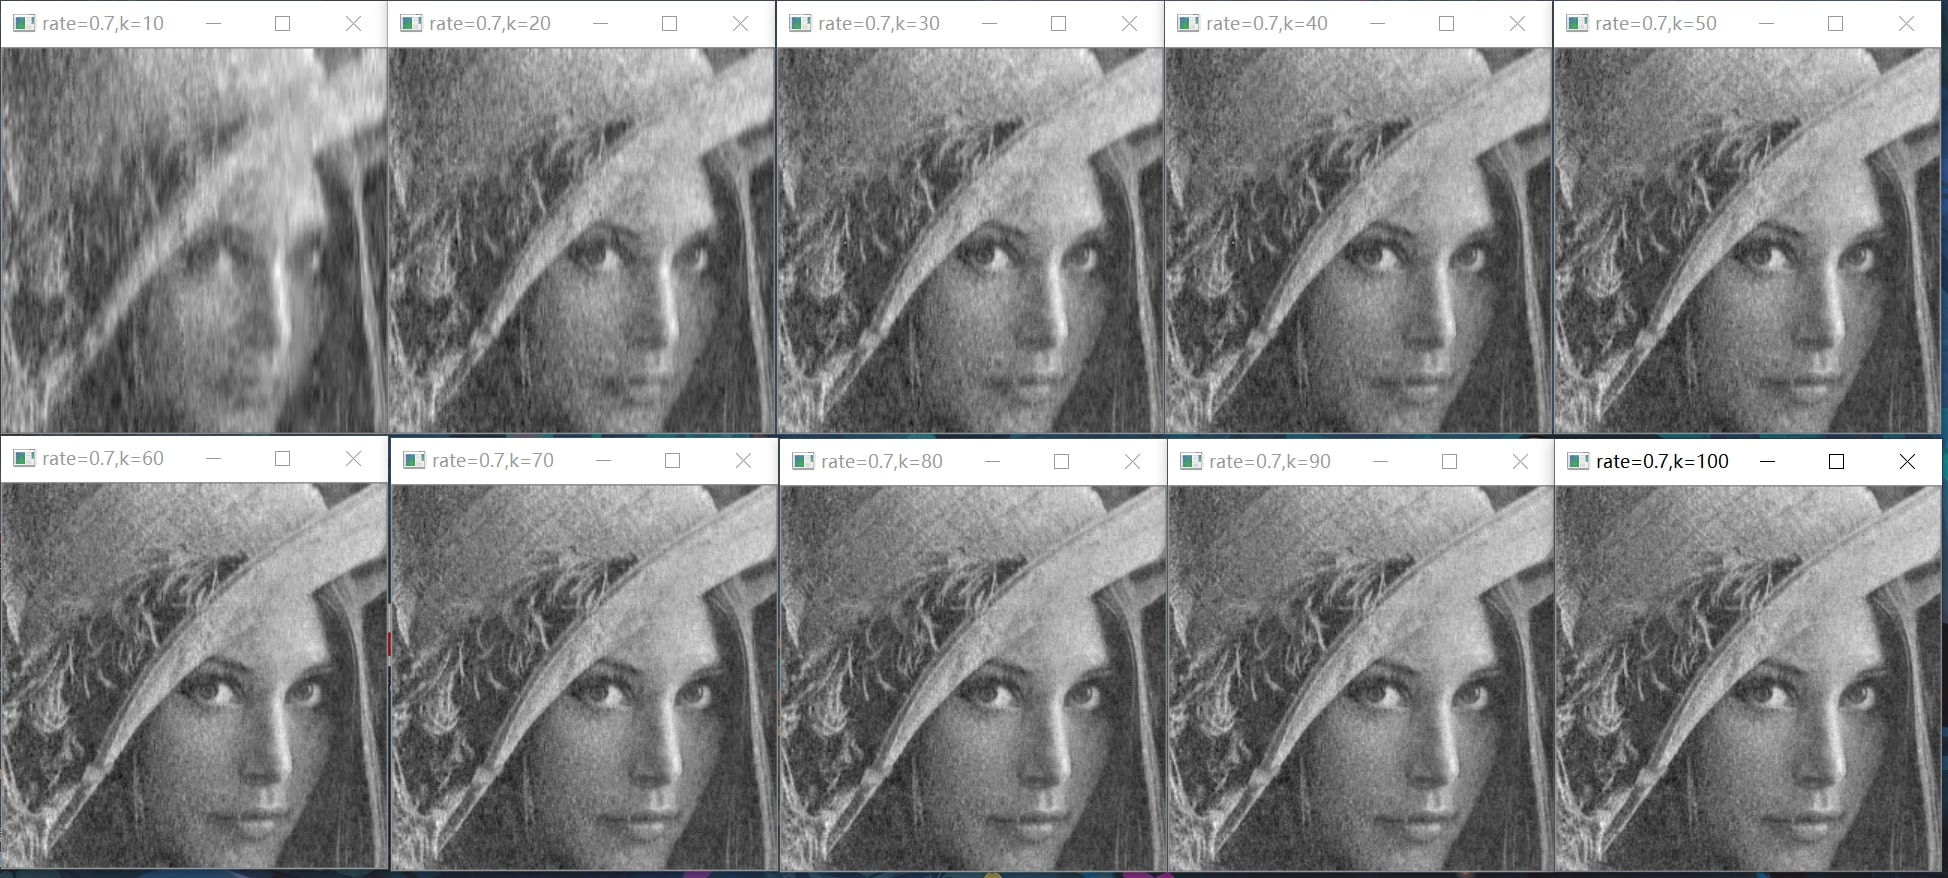
结果如下(其中,k为稀疏系数,sample_rate为采样率)

lena256_B

B_different_k

Code

code
1
2
3
4
5
6
7
8
9
10
11
12
13
14
15
16
17
18
19
20
21
22
23
24
25
26
27
28
29
30
31
32
33
34
35
36
37
38
39
40
41
42
43
44
45
46
47
48
49
50
51
52
53
54
55
56
57
58
59
60
61
62
63
64
65
66
67
68
69
70
71
72
73
74
75
76
77
78
79
80
81
82
83
84
85
86
87
88
89
90
91
92
93
94
95
96
97
98
99
100
101
102
103
104
105
106
107
108
import random
import numpy as np
import time
import sys
import cv2
import matplotlib.pyplot as plt
import scipy.optimize as spopt
import scipy.fftpack as spfft
import scipy.ndimage as spimg

# OMP algorithm
def OMP(y,A,K):
col = A.shape[1]
residual = y
ind = []
for i in range(K):
prod = np.fabs(np.dot(A.T,residual))
pos = np.argmax(prod)
ind.append(pos)
a = np.dot(np.linalg.pinv(A[:,ind]),y)
residual = y-np.dot(A[:,ind],a)

Res = np.zeros((col,))
Res[ind] = a
# print(Res.shape)
return Res

img = cv2.imread("lena.jpg")
img = img[128:128+256, 128:128+256, 0]

# cv2.imshow("img",img)
# cv2.waitKey(0)

# radom gaussian matrix ----> undersample
sample_rate = 0.7
N = 256
Phi = np.random.randn(int(sample_rate*N),N)
Phi /= np.linalg.norm(Phi)

# plt.imshow(Phi)
# plt.colorbar()
# plt.show()
# exit(0)


# DCT matrix ----> sparse base
Psi = np.zeros((N,N))
n = np.array(range(N))
for k in range(N):
Psi[k,:] = (2/N)**0.5*np.cos((2*n+1)*k*np.pi/2/N)
Psi[0,:] /= 2**0.5
Psi = Psi.T

# plt.imshow(Psi)
# plt.colorbar()
# plt.show()
# exit(0)


# measurement ----> undersample image
measure_mat = np.dot(Phi,img)

# K coefficient for N colomns
sparse_coe = np.zeros((N,N))

# θ = Φ ψ
Theta = np.dot(Phi,Psi)


time_consume = []
# OMP for every colomn
for k in range(20,40,10):
st = time.perf_counter()
for i in range(N):
sparse_coe[:,i] = OMP(measure_mat[:,i],Theta,k)
en = time.perf_counter()
img_rec = np.dot(Psi,sparse_coe)
img_rec /= img_rec.max()
img_rec *= 255
img_rec = img_rec.astype(np.uint8)
# print(img_rec.shape)
# print(img.shape)
# cv2.imshow("img",img)
cv2.imshow("rate=%.1f,k=%d"%(sample_rate,k),img_rec)
sys.stdout.writelines(f"rate={sample_rate:.1f},k={k} runtime:{en-st}s\n")
time_consume.append(en-st)
cv2.waitKey(0)


# sparse_coe[sparse_coe!=0] = 255
# sparse_coe = sparse_coe.astype(np.uint8)
# cv2.imshow("sparse_coe",sparse_coe)
# cv2.waitKey(0)

# plt.figure(figsize=(12,8))
# # plt.plot([i for i in range(256)],img[:,0])
# # plt.plot([i for i in range(256)],img_rec[:,0])
# # plt.legend(['origin','reconstruction'],fontsize=15)
# # plt.title('Reconstruction result for column 0 with sample_rate=%.1f'%sample_rate, fontsize=15)
# plt.plot([i for i in range(10,110,10)],time_consume)
# plt.xlabel('K coefficient',fontsize=15)
# plt.ylabel('consuming time(s)',fontsize=15)
# plt.title('Consuming time for different k value',fontsize=20)
# plt.grid()
# plt.legend(['sample_rate=%.1f'%sample_rate],fontsize=15)
# plt.show()


本博客所有文章除特别声明外,均采用 CC BY-SA 4.0 协议 ,转载请注明出处!