1
2
3
4
5
6
7
8
9
10
11
12
13
14
15
16
17
18
19
20
21
22
23
24
25
26
27
28
29
30
31
32
33
34
35
36
37
38
39
40
41
42
43
44
45
46
47
48
49
50
51
52
53
54
55
56
57
58
59
60
61
62
63
64
65
66
67
68
69
70
71
72
73
74
75
76
77
78
79
80
81
82
83
84
85
86
87
88
89
90
91
92
93
94
95
96
97
98
99
100
101
102
103
104
105
106
107
108
109
110
111
112
113
114
115
116
117
118
119
120
121
122
123
124
125
126
127
128
129
130
131
132
133
134
135
136
137
138
139
140
141
142
143
144
145
146
147
148
149
150
151
152
153
154
155
156
157
158
159
160
161
162
163
164
165
166
167
168
169
170
171
172
173
174
175
176
177
178
179
180
| import numpy as np
import tensorflow as tf
import keras
import pandas as pd
import matplotlib.pyplot as plt
import seaborn as sns
import matplotlib as mpl
from sklearn.preprocessing import OneHotEncoder
from sklearn.preprocessing import MinMaxScaler
mpl.rcParams['figure.figsize']=8,6
from datetime import datetime
def series_to_supervised(data, n_in=1, n_out=1, dropna=True):
'''
data: origin data
n_in:
'''
n_vars = 1 if type(data) is list else data.shape[1]
df = pd.DataFrame(data)
cols, names = list(),list()
for i in range(n_in,0,-1):
cols.append(df.shift(i))
names+=[('var%d(t-%d)'%(j+1, i)) for j in range(n_vars)]
for i in range(0, n_out):
cols.append(df.shift(-i))
if i==0:
names += [('var%d(t)'%(j+1)) for j in range(n_vars)]
else:
names += [('var%d(t+%d)'%(j+1, i)) for j in range(n_vars)]
agg = pd.concat(cols, axis=1)
agg.columns = names
if dropna:
agg.dropna(inplace=True)
return agg
def plot_history(model_history):
plt.plot(model_history.history['loss'],label='train_loss')
plt.plot(model_history.history['val_loss'],label='vlaid_loss')
plt.legend(fontsize=15)
plt.title('loss-epoch graph',fontsize=15)
plt.xlabel('epoch',fontsize=15)
plt.ylabel('loss',fontsize=15)
plt.grid(linestyle='--',alpha=0.5)
plt.legend()
plt.show()
data = pd.read_csv('PRSA_data_2010.1.1-2014.12.31.csv')
data.drop(['year','month','day','hour','No'],axis=1,inplace=True)
data['pm2.5'].fillna(0, inplace=True)
data = data[24:].reset_index()
data.drop(['index'],axis=1,inplace=True)
data.columns=['pollution','dew','temp','press','wnd_dir','wnd_spd','snow','rain']
enc = OneHotEncoder(sparse=False)
obj_cols = ['wnd_dir']
trans = pd.DataFrame(enc.fit_transform(data[obj_cols]))
trans.columns=['dir_1','dir_2','dir_3','dir_4']
data.drop(obj_cols, axis=1, inplace=True)
oh_data = pd.concat([data, trans], axis=1)
old_order = list(oh_data)
t=old_order[4]
old_order[4]=old_order[0]
old_order[0]=t
oh_data = oh_data[old_order]
scaler = MinMaxScaler(feature_range=(0,1))
scaled_data = scaler.fit_transform(oh_data[[name for name in oh_data.columns]])
reframed_data = series_to_supervised(scaled_data, 1, 1)
useless_cols = reframed_data.columns[12:]
reframed_data.drop(useless_cols,axis=1,inplace=True)
reframed_data.head()
reframed_data.info()
train_ratio = 0.6
valid_ratio = 0.2
train_days = int(train_ratio*len(reframed_data))
valid_days = int(valid_ratio*len(reframed_data))
test_days = len(reframed_data)-train_days-valid_days
train = reframed_data.values[:train_days,:]
valid = reframed_data.values[train_days:train_days+valid_days,:]
test = reframed_data.values[train_days+valid_days:,:]
train_x, train_y = train[:,:-1], train[:,-1]
valid_x, valid_y = valid[:,:-1], valid[:,-1]
test_x, test_y = test[:,:-1], test[:,-1]
train_x = train_x.reshape((train_x.shape[0], 1, train_x.shape[1]))
valid_x = valid_x.reshape((valid_x.shape[0], 1, valid_x.shape[1]))
test_x = test_x.reshape((test_x.shape[0], 1, test_x.shape[1]))
print(train_x.shape,train_y.shape,valid_x.shape,valid_y.shape,test_x.shape,test_y.shape)
model = keras.Sequential([
keras.layers.LSTM(50, activation='relu', input_shape=(train_x.shape[1],train_x.shape[2])),
keras.layers.Dense(1, activation='linear')
])
model.compile(optimizer='adam',
loss='mean_squared_error')
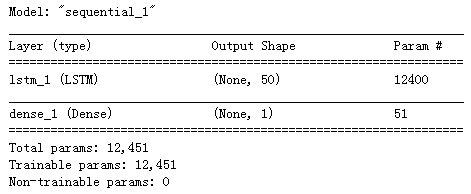
model.summary()
early_stop = keras.callbacks.EarlyStopping(monitor='val_loss',patience=10)
class PrintDot(keras.callbacks.Callback):
def on_epoch_end(self, epoch, logs):
if epoch%25==0:
print(" ")
print(".",end='')
model_history = model.fit(train_x, train_y,
epochs=50,
batch_size=72,
validation_data=(valid_x, valid_y),
verbose=0,
callbacks=[early_stop,PrintDot()],
shuffle=False)
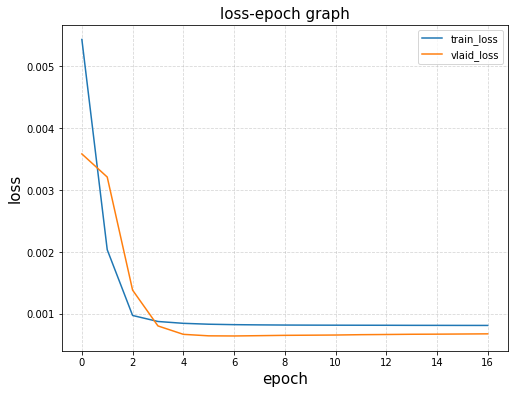
plot_history(model_history)
evaluate_res = model.evaluate(test_x,test_y)
print(evaluate_res)
preds = model.predict(test_x)
plt.plot(preds[8600:],label='test_predict')
plt.plot(test_y[8600:], label='test_actual')
plt.legend()
plt.show()
for i in range(10):
preds=np.column_stack((preds, np.zeros(len(test_y))))
inverse_preds = scaler.inverse_transform(preds)
origin_test_y = oh_data['wnd_spd'][train_days+valid_days:]
origin_test_y = [x for x in origin_test_y]
def plot_trends(hour_begin, hour_end):
plt.plot(inverse_preds[hour_begin:hour_end,0],label='actual_preds')
plt.plot(origin_test_y[hour_begin:hour_end], label='actual_test_y')
plt.legend(fontsize=15)
plt.xlabel('hour',fontsize=15)
plt.ylabel('wind_speed',fontsize=15)
if hour_end-hour_begin<=24:
plt.title('{0}_hours_line'.format(hour_end-hour_begin),fontsize=15)
else:
plt.title('{0:.0f}_days_line'.format((hour_end-hour_begin)/24),fontsize=15)
plt.grid(linestyle='--',alpha=0.5)
plt.show()
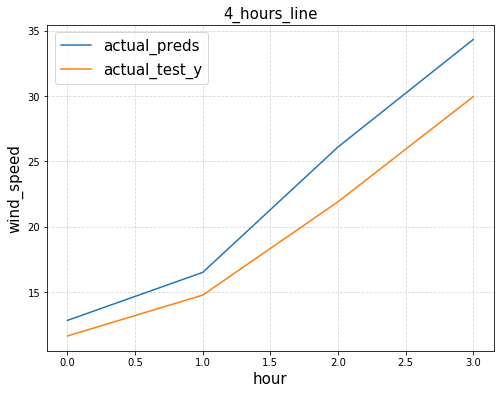
plot_trends(8000,8000+4)
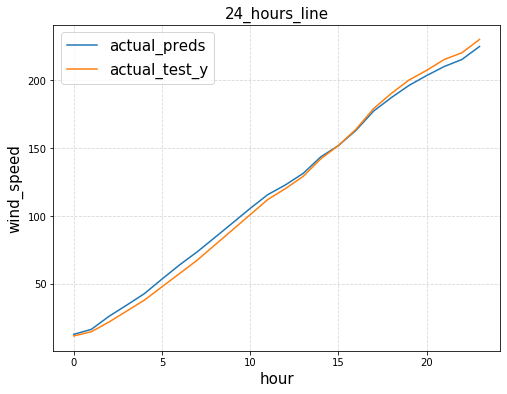
plot_trends(8000,8000+24)
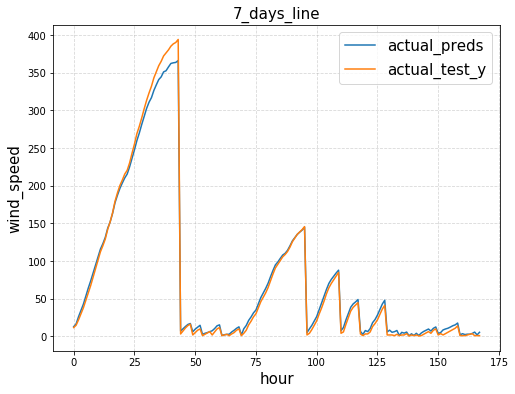
plot_trends(8000,8000+24*7)
|
